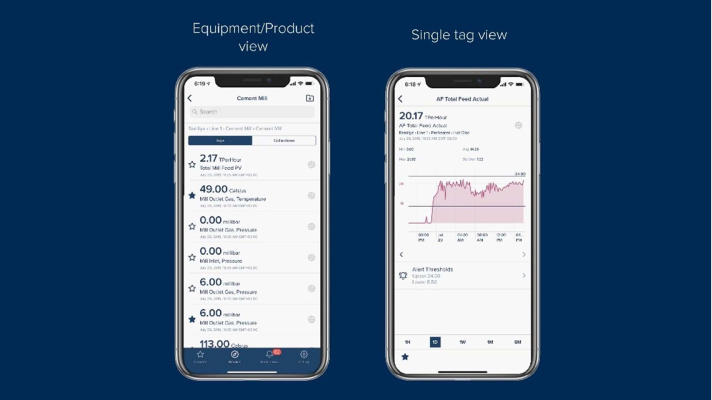
Real-time and historical user-friendly trends allow you to monitor the performance and health of your assets – from 1 hour to 6 months trends visualisation on-the-go. You can easily identify and find individual data signals – or ‘tags’ in the app. You can also group tags into ‘collections’ to offer snapshot summary reports of KPIs, such as production levels, equipment performance or equipment health. You can add tags and collections to your favourite list for quick recall later.
